A while back, I was chatting with Marc Anderson about TypeScript. Neither of us had used it yet and we had a discussion about its capabilities and usefulness. One of the items in our discussion was the debugging experience once the TypeScript is transpiled into JavaScript.
I am working on a project with a fair amount of JavaScript, so I took the opportunity to use TypeScript. The effort to setup my dev environment in VSCode is worthy of another post, but for now I want to show how the debugging works.
I wrote a .ts file and used gulp to "compile" to JavaScript. Another gulp task copied the files to a SharePoint library (thanks Wictor!).
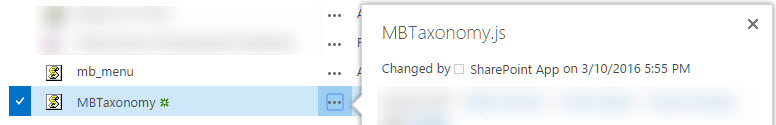
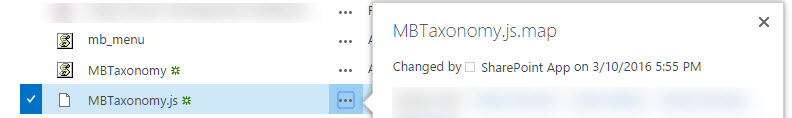
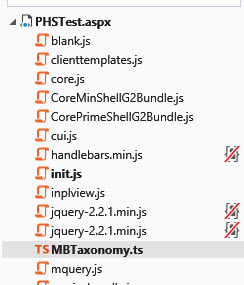
First, the JavaScript and the related sourcemap are included in the same library:
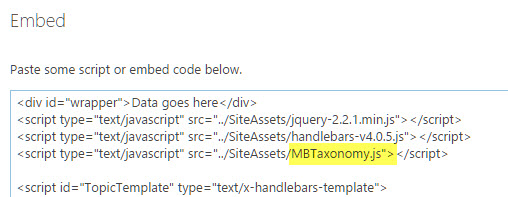
Next, I used the "Embed" button to add a Script Editor Web Part into a publishing page. Notice that the script tag references the .js file.
Once the page has rendered, using the browser tools shows that the original typescript file is loaded! Very cool!
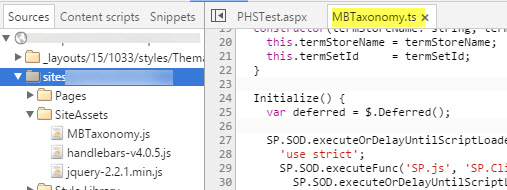
Source in Chrome
Source in IE12
I found the debugging experience to be quite nice. Better than JavaScript, but not as nice as C#. And the compile-time checking of TypeScript is nice to have. I cannot wait to dig in further.