I previously posted about using AppInsights to help troubleshoot an issue. I wanted to post a follow-up to show some of the other capabilities of the AppInsights offering.
The first step toward resolving the application issue was to implement caching. While Azure provides a Redis Cache service, the initial implementation put in place was the ASP.Net cache. As we saw from our AppInsights data, the web server is not under stress. So, using the built-in ASP.Net cache instead of paying for the Redis cache was chosen. We can certainly upsize later if necessary.
Monitoring the ASP.Net cache is possible using Performance Monitor. Application Insights has the capability to store and report on performance counters. I chose to implement this thru the ApplicationInsights.config file. This file is added to the Visual Studio project when the Application Insights SDK is added via NuGet. I add two counters to the AppInsights config file, which will then be captured by the status monitor application and send to the Azure service:
<Add Type="Microsoft.ApplicationInsights.Extensibility.PerfCounterCollector.PerformanceCollectorModule, Microsoft.AI.PerfCounterCollector">
  <Counters>
    <Add PerformanceCounter="\ASP.NET Apps v4.0.30319(??APP_W3SVC_PROC??)\Cache Total Turnover Rate"
         ReportAs="Cache T/O Rate" />
    <Add PerformanceCounter="\ASP.NET Apps v4.0.30319(??APP_W3SVC_PROC??)\Cache Total Hit Ratio"
         ReportAs="Cache Hit Ratio" />
  </Counters>
</Add>
The performance counters include a placeholder (??APP_W3SVC_PROC??) that indicates I want only the current instance of the ASP.NET Application counters. Without specifying the instance placeholder, the service would get counters for every ASP.NET application on the server. In some cases, this may be what you want.
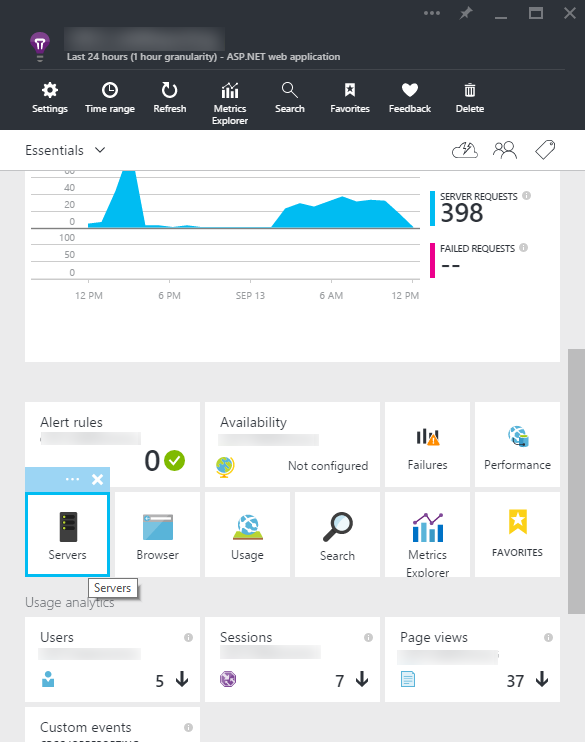
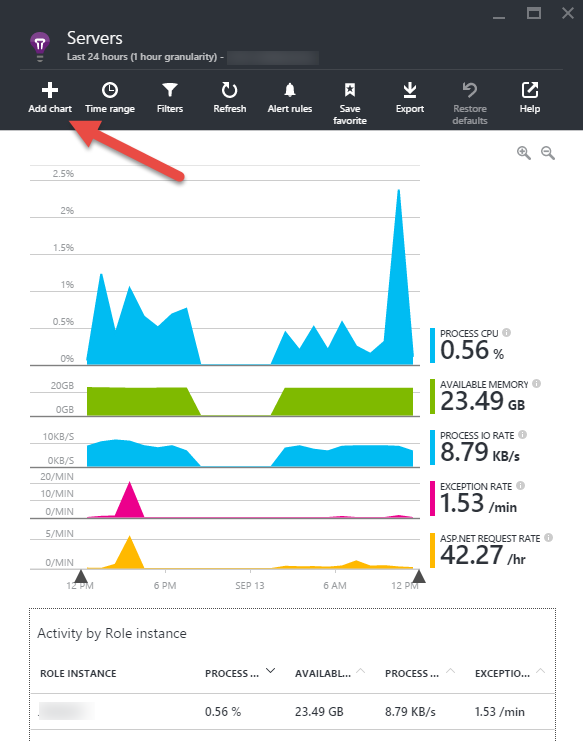
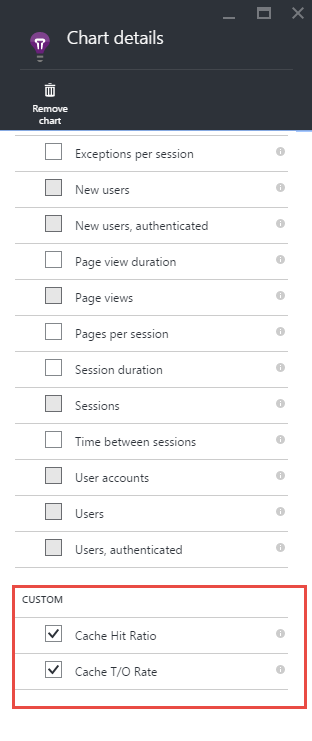
After updating the configuration file and running thru some of the application pages, the performance counters are visible in the portal. I decided to add the cache counters to the default Server chart. I clicked on the Servers blade, then clicked Add Chart. On the Chart Details blade, the counters I added via the configuration file are at the bottom of the list.
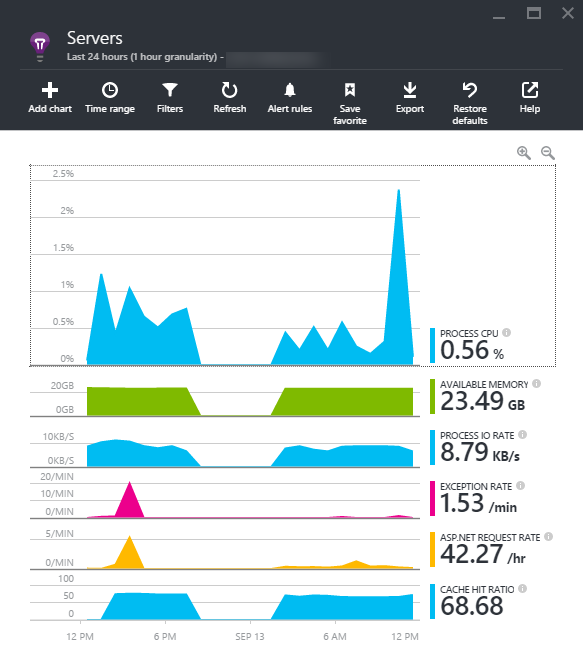
After my updates, I can see at a glance the cache statistics:
Since the application now has the App Insights SDK added, we can consider implementing custom events. The issue in this application was the data retrieval for the search form. In a future post, I will discuss how AppInsights custom events can tell us exactly which columns are actually being used for searches. This tracking data can then be used to discuss with users whether the search form should be changed, or perhaps additional pages built to provided the desired information without searching. The goal being a friendlier, intuitive application that helps people get their job done, without being a job they need to do to do their job.