I was asked to look into an intermittent error a client was having in their web-based application. This article details how I was able to use Azure Application Insights and Windows Performance Monitor to locate the source of the error.
Application Architecture
The application in question was built in 2008, using ASP.NET Web Forms. The database layer is implemented using new-at-time technology called LINQ to SQL. (Today, that is known as Entity Framework.)
A few months ago, the on-premises server was retired and the application moved to Azure IaaS. The database server is configured following Microsoft’s guidance for SQL Server in Azure VMs. (Keep in mind, that link shows the current guidance. At the time of our deployment, the D-series VMs were in preview and the DS/GS series were not available.) One key item in this guidance is to put user databases on a striped set using Storage Spaces. The virtual hard disk in our deployment uses two “disks” in the set.
The home page of the application presented a list of Jobs to which the current user is assigned. The list generally has a few hundred items, and the application was using server-side paging (via the Skip() and Take() methods of LINQ). The page displays a grid with 6 columns. However, there is a “query-by-form” page that allows users to search for jobs on a dozen different columns, some of which are in related tables.
Since this was the first deployment to Azure for the organization, I installed the Application Insights Status Monitor application on the web server. I also updated the web pages to include the javascript for monitoring usage. My thinking was, why not provide a little extra value by leveraging the free tools available in the cloud.
To read about using Application Insights in a single-page app (SPA), be sure to read Andrew Connell's post Using Azure Application Insights with Single Page Apps.
Reported Issue
The application has a global event handler to catch exceptions and render the message is a generic page. And one particular exception was happening for the business user who is in-charge of the group of users for whom the application is mission-critical:

The error was intermittent, but generally early in the day. And only for one user. Once the user reported the error, it was generally not reproducible. And of course, with the application working fine for everyone except the person who controlled the budget, it was a very urgent issue!
Locating the Issue
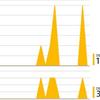
The more-technical readers will likely recognize the error. The database connection from the web server to the database server is timing out. Like many situations, having solid evidence would make any suggested remediation more likely to be followed. So I set about to see what I could learn from App Insights. The initial blade of App Insights in the Azure Preview Portal has a graph of Failures. Clicking on the Failures graph opened the Failures blade, which had a breakdown of the failures by dependency:
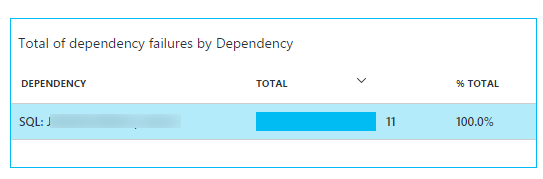
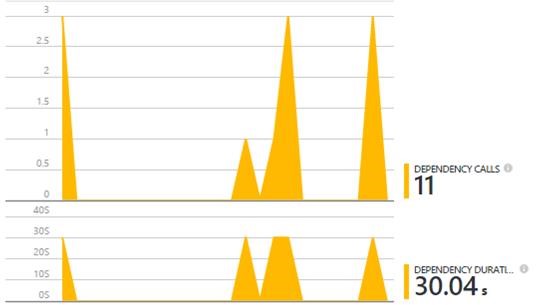
The timeline for the failures matched the time of the reporting errors. In addition, the duration is just over the configured database connection timeout. I was immediately able to prove that the issue was with the database server and not the web server.
Isolating the Issue
To recap what we know about the issue:
- The error is a database connection timeout.
- The error occurs for a single user, who uses the application in an administrative capacity.
Clearly, the circumstances of the administrative user cause the database query to run longer than regular users. After some discussion, I learned that the initial view of this administrative user does not have jobs assigned to them, rather jobs assigned to all of his direct reports. So, the failure is due to reading more rows than is usual.
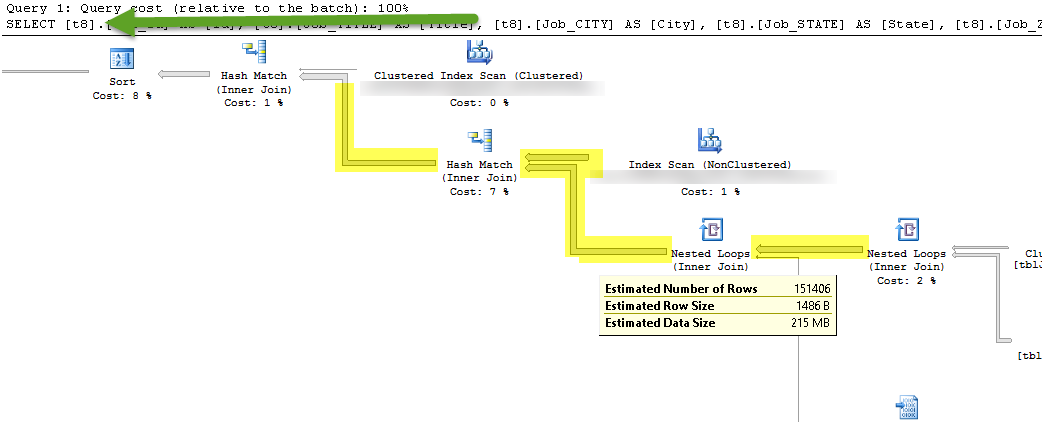
My first hunch was that the query could be improved by adding an index. Using SQL Server profiler, I grabbed the query being executed for our administrative user. (TIP: In your database connection string, set the “ApplicationName” key to a value that will uniquely identify your applications. In the cases of a shared SQL Server deployment, this makes finding your entries in the profiler much easier.) Take the T-SQL statement and use SQL Server Management Studio to display the query execution plan.
Unfortunately, my query did not need any additional index. In the figure below, any missing index would be displayed in the header, where you see the green arrow. However, notice the think lines that I have highlighted in yellow? Hover the mouse over those lines provides information about that operation. What caught my attention was the not the number of rows, rather the Estimated Data Size. I summed up the estimates for all operations in my query – 1.2 GB!!
Database Server Monitoring
I set about trying to prove that reading over 1GB in a single web page was causing the issue. (Remember, hard facts, not just developer-sense.) Having read all about the SQL Server performance on Azure VMs, my thinking was the 500 IOPs / disk limit. I used Performance Monitor (PerfMon) to track the system while I ran the query in Management Studio. The Disk Ops/sec on the virtual drive containing the user database showed a maximum of 737. Remember, my drive has two disks (Azure Storage blobs) giving me a maximum of 1,000 Disk Ops/sec. In this case, the hard facts dis-proved my hunch! However, the Read Bytes/sec metric was flat-lined at 12 MB. Simple math tells us that reading 1.2GB at a rate of 12MB/sec will require 100 seconds to complete. I went back to Management Studio and looked at the status bar of the just-completed query. It took 105 seconds. The PerfMon metric matches the measured response. The server is disk-bound with a data transfer rate of 12MB/second.
Remediate Options and Lessons Learned
With a clearly defined bottleneck, the discussion of remediation becomes much more focused. The application can be changed to request less data. The server can be upgraded to provider greater throughput. Like many customers, the initial preference is to throw hardware at the problem. In Azure, there is a mostly predictable cost associated upgrading the provisioned resources compared to the risk of making an application change that may break other things. (Remember, this is a 7 year-old application.) Making the decision more complicated – the Azure datacenter in which the VMs reside does not yet offer Premium Storage. (The actual resolution is not relevant to this article.)
Another item worth discussing is the expectation/usage of the application over time. Clearly, the administrative user’s home screen was not considered when the application was first developed. In addition, the query-by-form requirements greatly exaggerate the data rquirements of the query. Using this resource-intensive query for the most-used page of the application was bound to cause problems at some point. (Yes, the home page with the job list is the most-used page. This is yet another fact supported by evidence from Application Insights.)
For most developers, the monitoring and investigation of applications is an after-thought. And often, when support requests come in, the initial response is to try and debug the application or replicate the environment. But using the tools available in Windows and in Azure, combined with a basic knowledge of the application infrastructure, we can quickly and accurately isolate issues start working toward a resolution.